Can we beat Wall Street using
✨FoundationForecast?
Q3 2026 earnings from 10 public companies with 24 Time Series Foundation Models, measuring the latest time series foundation models against the Wall Street consensus.
This is not investment advice. Nothing here says anything about whether to buy or sell a stock. It's an exploration of how a new kind of tooling could change who gets to do this kind of analysis.
Time series foundation models on public markets
This is the next experiment in a series that tests time series foundation models on real-world data. The first one forecast token usage on OpenRouter [1]. Now the test is something almost everyone in the U.S. can access, the public financial markets. Quarterly results are public, the filings behind them are free on the SEC's EDGAR system [2], and analyst expectations show up in the financial press. Still, turning all that into a forecast takes tools and training most people don't have, so markets that are open on paper are hard for non-experts to dive into. The question here is whether time series foundation models, served through FoundationForecast, can help open that up.
The bar for these models is high, and it should be. Rob Hyndman made the skeptical case really well in a recent post [3]. He points out that published comparisons often use weak statistical baselines [4], that the datasets in public benchmarks keep showing up in the models' training data [5], and that a leaderboard averages over so many domains that it can hide how a model does on the series that actually matter. He closes with a key thought.
“A model that tops a MASE leaderboard by a small margin but takes an order of magnitude longer to run, or performs poorly on genuinely new data, may be the wrong choice operationally even if it’s the ‘best’ model on paper.” [3]
The field needs shared, realistic evaluation, with honest baselines next to the new models and data the models can't have seen. A company's next quarterly revenue is about as fresh as test data gets, since it doesn't exist until the company reports it. Every forecast here was locked before report day, so there's no way for the answer to leak in.
Running that kind of evaluation across dozens of models is the hard part. FoundationForecast, our newly released open-source unified API for time series foundation models, takes care of it. It runs all 24 foundation models in this test, plus the seasonal-naive baseline, through one interface, so their actual performance can be checked on the same data in the same way. Its catalog now also includes the classical auto models (AutoARIMA, AutoETS, AutoTheta and AutoCES), and in this test AutoARIMA, AutoETS and AutoTheta were run locally on the same quarters. The rest (Naive, Prophet, LightGBM, XGBoost and N-BEATS) come from the wider TimeCopilot stack. Results are still coming in, with four of the ten companies yet to report, and there's no definitive answer yet on whether these models beat Wall Street or older methods. In this test, though, the evidence leans their way at the horizon that matters most here, the next quarter. The best foundation model beat the Wall Street consensus on 6 of 7 report days, and all six of the models with a smaller typical miss than Wall Street over the season are foundation models. Every one of the 24 beat AutoETS on report day. AutoARIMA was the toughest classical baseline, with 9 of the 24 ahead of it, and on two report days a classical model was closest of all (AutoTheta [6] on Coinbase and AutoARIMA [7] on Palantir).
That practical angle is the focus here. For investors and for the companies themselves, the next quarter is the number everyone waits for. It shapes guidance, the stock's move on report day and a lot of planning, and it's the one forecast Wall Street publishes for nearly every big company. That makes it a fair place to line these models up against the consensus. And few numbers get as much attention, four times a year, as an earnings report.
Why stocks
Earnings make a good test because a lot rides on the forecast, and the forecast is expensive. The Wall Street consensus is the average of what sell-side analysts expect, and getting to it costs money. A single Bloomberg Terminal seat was priced at $31,980 a year for 2025 [8]. Research has a price tag too. When MiFID II forced banks in Europe to charge for research separately, UBS was reported to ask about $40,000 a year for basic access [9], and prices across the industry ranged from $1,600 to $1 million [10].
Coverage is also patchy. About a quarter of U.S.-listed companies have no analyst coverage at all, according to a recent Seeking Alpha analysis as summarized by Pluang [11]. That gap has real effects. Derrien and Kecskés found that companies that lost an analyst because a broker closed or merged went on to cut investment and financing compared with similar companies that didn't [12]. Even covered companies often get a consensus only for the headline number. For three of the four report days still to come in this test (Disney Experiences, Nvidia Data Center and Walmart U.S.), no segment consensus had been captured at the time of writing.
A forecast that costs an API call instead of an analyst team could fill some of those gaps. Whether it's any good is an empirical question, and an earnings report is a hard, public, dated test of it.
Why these companies
The ten companies were picked to span big parts of the U.S. economy, with a mix of steady and fast-changing businesses. The test follows one quarterly series for each, and two for McDonald's.
- Crypto exchange. Coinbase net revenue, which swings with trading volume.
- Consumer tech. Apple iPhone net sales, with a big holiday quarter every year.
- Software and AI. Palantir revenue, which has grown every quarter for years.
- Semiconductors. AMD Data Center revenue and Nvidia Data Center revenue, both riding the AI buildout.
- E-commerce. Shopify GMV, the gross merchandise volume sold through Shopify merchants, with a big holiday quarter.
- Restaurants. McDonald's total and franchised revenues, the steadiest series in the set.
- Media and theme parks. Disney Experiences revenue.
- Home improvement. Home Depot net sales.
- Big-box retail. Walmart U.S. net sales.
Coinbase, Apple, Palantir, AMD, McDonald's and Shopify have reported. Disney, Home Depot and Nvidia report on November 17, and Walmart reports on November 19.
Why publish before all reports are live?
Publication waited until some of the companies had reported, so the results would have something real behind them, and so far they've been good. The coin is still in the air, though. Four of the 10 companies tracked (40%) haven't reported yet (4 of 11 series), and their forecasts are already locked and shown below. If Nvidia steps up the way AMD did, the picture could change.
What was tested
The test covers 11 quarterly series from 10 companies, taken from SEC filings in U.S. dollars. Each series got 33 models.
- Foundation models (24). Chronos-2, Chronos-Bolt, TimesFM, TiRex, Toto, Timestral, t0, TimeH2O, Tabby and Granite PatchTST in their various sizes, all served through FoundationForecast's hosted API, along with the seasonal naive baseline (same quarter last year).
- Statistical, machine learning and deep learning models (8). AutoARIMA, AutoETS, AutoTheta and Naive from statsforecast, LightGBM and XGBoost from mlforecast on first-differenced values with lags 1 to 4, N-BEATS from neuralforecast, and Prophet with yearly seasonality.
The second group mixes two kinds of model. AutoARIMA, AutoETS and AutoTheta are now part of FoundationForecast as well, next to AutoCES, which wasn't in this test, but here they ran locally with statsforecast. Naive, Prophet, LightGBM, XGBoost and N-BEATS come from the wider TimeCopilot stack. Classical models like AutoARIMA, AutoETS and Prophet are also evaluated in Impermanent, a live benchmark for temporal generalization [13]. All eight ran locally on exactly the same quarters and the same protocol as the API models.
Before any report day, every model went through cross-validation on the last 12 quarters. For each one it saw only the data available at the time and forecast one quarter ahead. Each quarter's error was divided by seasonal naive's error and the 12 ratios were combined with a geometric mean. That's relative MASE [14], the same scale GIFT-Eval [15] and fev-bench [16] use, so 1 means no better than naive and lower is better.
Then every model's next-quarter forecast was locked and scored against the reported number afterwards. The series were forecast on different dates, from October 28 to November 2, 2026, all before the actuals came out. Lock dates are in UTC, so Coinbase shows October 29 for both its lock and its report: the forecasts were locked at 00:11 UTC that day, which is 5:11 p.m. Pacific on October 28, about 20 hours before Coinbase reported after the close. The one exception is Shopify's eight locally run models, which we added on November 4 Pacific time, after its November 3 report, on history ending in Q2 2026, so the reported number was not in their data. Nothing was refit after a report day. For the season score, each model's miss on a report day is divided by seasonal naive's miss on the same report day, and those ratios are combined with a geometric mean. Wall Street's consensus gets scored exactly the same way, which puts it on the same board as the models.
This page uses two rankings. Report-day leaderboards list the models closest to the reported number first, and “finished #” is a model's place there. Cross-validation is the other one: “CV #”, “ranked on cross-validation” and the leaderboard going into a report all refer to the 12-quarter order described above.
Report by report
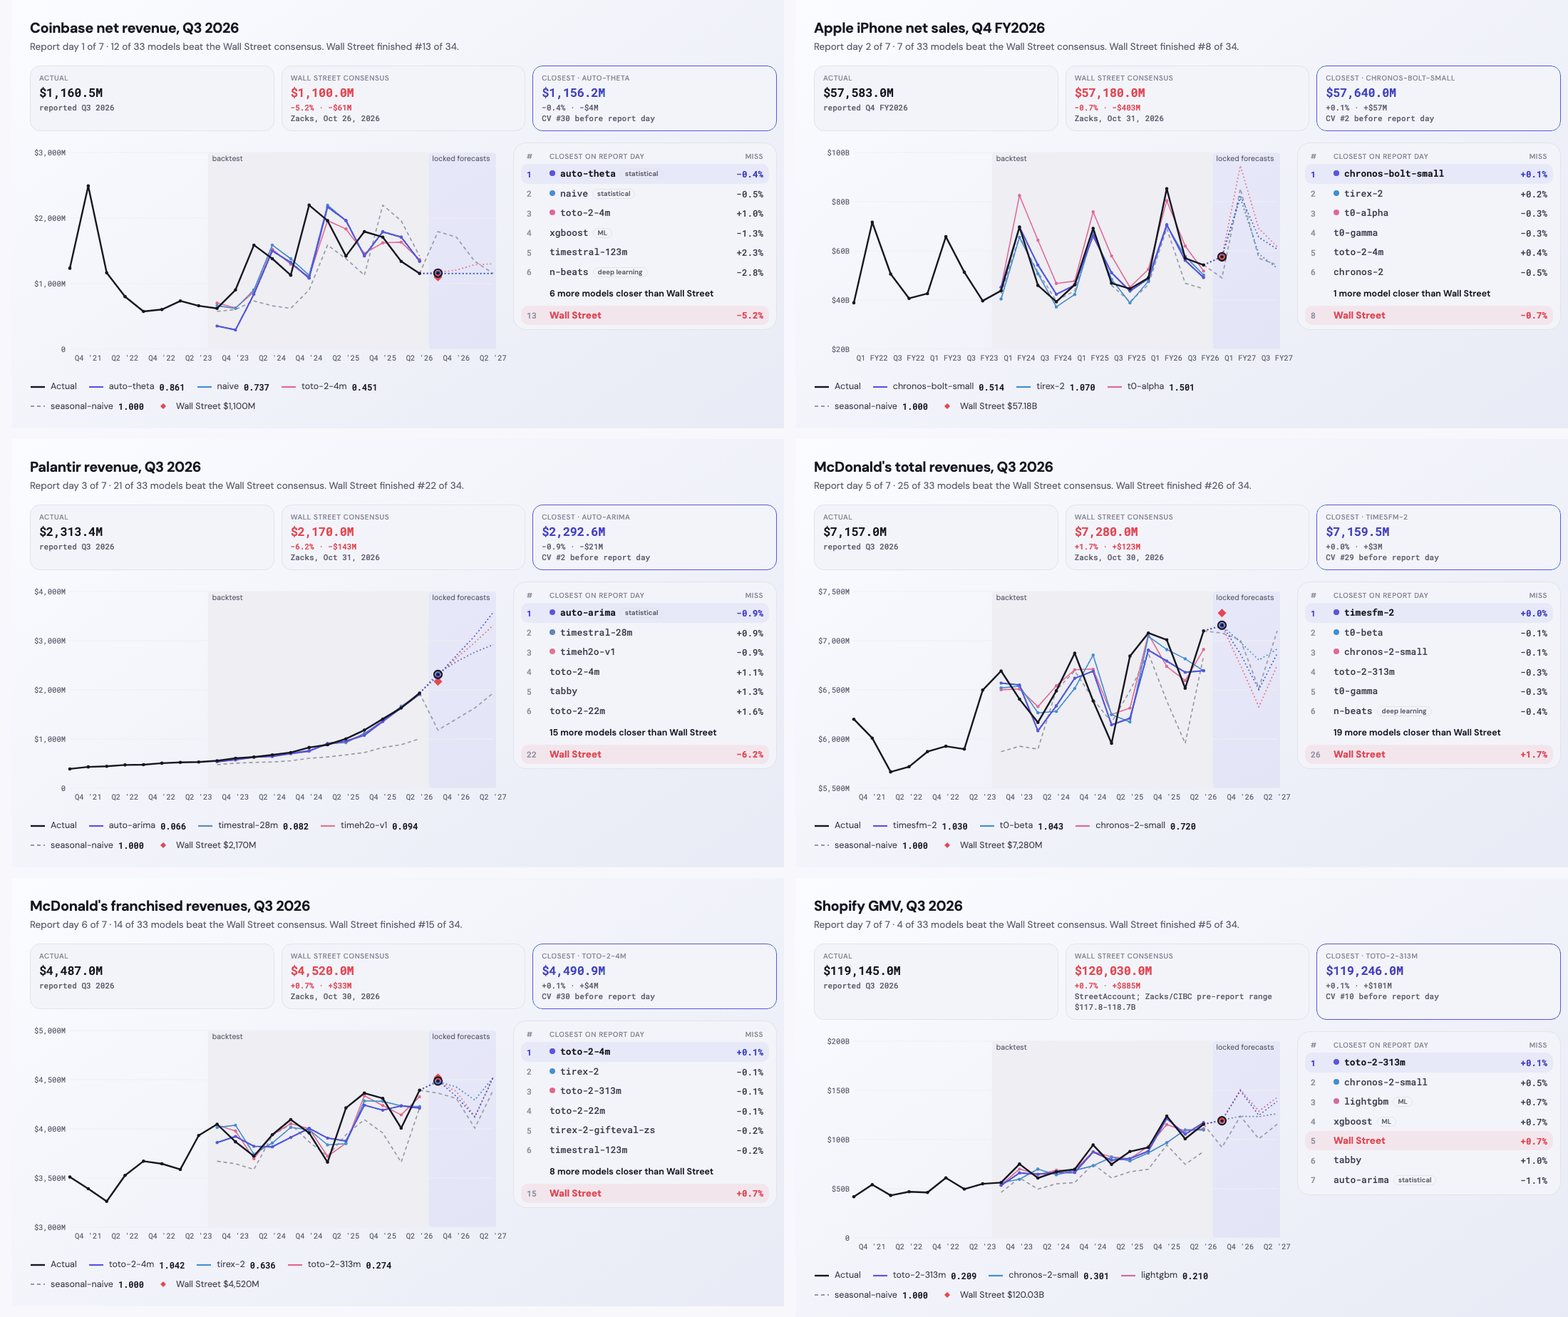
The models beat Wall Street most easily on McDonald's total revenues and Palantir revenue, where 25 and 21 of 33 models beat the consensus. Shopify GMV was the hardest of the ones that fell, since Wall Street was only 0.7% off and just 4 models did better. Figure 1 shows every report day with all 33 models and Wall Street in the order they finished.
Table 1
Scorecard, 7 report days
Locked forecasts against the reported number. A miss is forecast minus actual, so negative means too low. Tap or click a row to open that report day in Figure 1.
| Report day | Actual | Wall Street miss | Closest model | Cross-validation #1 | Beat Wall St. |
|---|---|---|---|---|---|
| Coinbase net revenueQ3 2026 | $1,160M | −$60M−5.2% · Zacks, Oct 26, 2026 | auto-theta−$4M · CV #30 | timestral-5m+$48M · finished #11 | 12 of 33 |
| Apple iPhone net salesQ4 FY2026 | $57.58B | −$403M−0.7% · Zacks, Oct 31, 2026 | chronos-bolt-small+$57M · CV #2 | tabby+$1,408M · finished #21 | 7 of 33 |
| Palantir revenueQ3 2026 | $2,313M | −$143M−6.2% · Zacks, Oct 31, 2026 | auto-arima−$21M · CV #2 | tabby+$30M · finished #5 | 21 of 33 |
| AMD Data Center revenueQ3 2026 | $8,546M | −$276M−3.2% · Zacks, Oct 29, 2026 | timesfm-2−$964M · CV #1 | timesfm-2−$964M · finished #1 | 0 of 33 |
| McDonald's total revenuesQ3 2026 | $7,157M | +$123M+1.7% · Zacks, Oct 30, 2026 | timesfm-2+$2M · CV #29 | granite-patchtst-r2−$59M · finished #14 | 25 of 33 |
| McDonald's franchised revenuesQ3 2026 | $4,487M | +$33M+0.7% · Zacks, Oct 30, 2026 | toto-2-4m+$4M · CV #30 | granite-patchtst-r2+$60M · finished #24 | 14 of 33 |
| Shopify GMVQ3 2026 | $119.14B | +$885M+0.7% · StreetAccount via CNBC, Nov 3, 2026 | toto-2-313m+$101M · CV #10 | n-beats+$2,338M · finished #14 | 4 of 33 |
Figure 1
Each report day, ranked by closeness
AMD, the miss
AMD Data Center revenue came in at $8,546M, up 27% from $6,718M the quarter before. Wall Street was 3.2% low. Every one of the 33 models was at least 11% low, and the median foundation model forecast was about $7,107M. The closest model, TimesFM 2, was also the cross-validation leader, which makes AMD the only report day where the leaderboard got it right, and the right model still missed by $964M.
The reason is simple. Analysts had company guidance, customer orders and a sense of the AI buildout to go on. A model that reads one revenue series only sees its past, and when a business steps up faster than its own history suggests, the series is the last to know. Context is Key makes the same point from the research side, showing that forecasts improve when the model gets the background a human forecaster would use [17]. That's the honest limit of this setup, and a pretty clear pointer to what comes next.
GIFT-Eval and fev-bench vs report day
GIFT-Eval and fev-bench rank foundation models over hundreds of public datasets. The OpenRouter study found their order didn't carry over to token usage [1], and earnings look similar. If the benchmark order carried over, the lines in Figure 2 would run straight across. Ranked among these 20, GIFT-Eval's top three landed mid-pack on report day. Timestral 209M finished 7th, Timestral 123M finished 5th and t0-gamma finished 9th, out of 20. Meanwhile Toto 2 313M, 13th of 20 on GIFT-Eval, finished first.
Figure 2
Benchmark order vs earnings order
GIFT-Eval's quarterly slice does better, with a correlation of +0.60 against the earnings cross-validation, which makes sense since it's closer to this kind of data. Against the report days, it's still only +0.22. The overall GIFT-Eval order comes in at +0.13 and fev-bench at −0.15, basically no relationship. None of this means the benchmarks are wrong. They average over many domains, and a leaderboard can hide how a model does on the series that actually matter [3]. Benchmarks are guidance. The data and the setup pick the model.
Table 2
Rank correlation with the earnings results
Spearman correlation, foundation models only. 1 means the same order, 0 means unrelated.
| Ranking | vs earnings CV | vs report day | Models |
|---|---|---|---|
| GIFT-Eval, all data | +0.45 | +0.13 | 20 |
| GIFT-Eval, quarterly | +0.60 | +0.22 | 20 |
| fev-bench | +0.24 | −0.15 | 14 |
| Earnings cross-validation | · | +0.34 | 24 |
Company by company
Figure 3 shows any of the 11 series with its history, the 12 backtest quarters and the locked forecasts, either for the top 3 models on cross-validation or for the 3 that landed closest on report day.
Figure 3
History, backtest and locked forecasts
Coinbase. The most volatile series in the set, since revenue follows crypto trading volume. Net revenue came in at $1,160M. The Wall Street figure here is $1,100M, a miss of −$60M, from Zacks' October 26 preview, which put net revenue down 38.9% year over year. Against it, 12 of 33 models did better. The closest was AutoTheta, only $4M off, even though it ranked #30 on cross-validation.
Apple. iPhone net sales were $57.58B. The Zacks consensus of $57.18B missed by −$403M, only 0.7%, a tough bar. 7 of 33 models cleared it, led by Chronos-Bolt Small at +$57M. The answer also depends on which consensus counts. LSEG had $56.54B, and against that number 17 of 33 models beat Wall Street.
Palantir. Revenue was $2,313M, and Wall Street was $143M low (−6.2%). Palantir has grown every quarter for the past two years, and the models extrapolated that trend better than the consensus did. 21 of 33 models beat Wall Street, with AutoARIMA closest at −$21M.
AMD. The one report day where no model got close, covered above.
Shopify. Gross merchandise volume came in at $119.14B. The Wall Street figure of $120.03B (StreetAccount via CNBC, Nov 3, 2026) was $885M high, only 0.7%, and just 4 of 33 models beat it. Toto 2 313M was closest at +$101M, after ranking #10 on cross-validation.
McDonald's. The steadiest business here. Wall Street was $123M high on total revenues and $33M high on franchised revenues. 25 of 33 models beat it on total revenues and 14 on franchised, and the closest models, TimesFM 2 (+$2M) and Toto 2 4M (+$4M), had ranked #29 and #30 on cross-validation.
Still to come
Four report days are left, and their forecasts are already locked. Disney Experiences, Home Depot and Nvidia Data Center report on November 17, and Walmart U.S. reports on November 19. Home Depot is the only one with a consensus captured so far. Nvidia is the one to watch after AMD. Its Data Center revenue went from $41.10B to $89.02B in a year, the kind of step-up that tripped up every model on AMD.
Figure 4
Report days still to come
Model performance against Wall Street
Over the season, Wall Street scores 0.126, a typical miss about 8 times smaller than seasonal naive's. Six models scored lower, namely Toto 2 313M (0.076), Toto 2 4M (0.095), TiRex 2 (0.098), Toto 2 1B (0.103), Timestral 123M (0.109) and Timestral 28M (0.126). Timestral 28M and Wall Street both round to 0.126, and the model is ahead only in the 5th decimal place, so call that one a tie. The best model that isn't a foundation model was AutoARIMA in 10th at 0.150.
Figure 5
Model performance against Wall Street
Size isn't everything. Datadog's Toto shows up three times in the top six, at 313M, 4M and 1B parameters in that order, and Toto 2 4M beat Wall Street on 5 of 7 report days, more than any other model. So far, the scaling laws behind large language models don't seem to carry over to time series foundation models, at least not on short quarterly series with a few dozen points of history. The OpenRouter experiment [1] pointed the same way. There, Toto 2 4M was the best forecaster on all tokens 1 week ahead, Chronos-2 Small had the lowest error on individual LLMs at 1 week and Chronos-Bolt Mini led on categories at 4 weeks, each ahead of much bigger models. Small doesn't always win, though. Leaving out seasonal naive, the bottom of this board is Chronos-Bolt Mini (0.342), AutoETS (0.399) and Prophet (0.478), and Chronos-Bolt Mini, a standout on OpenRouter, is one of them.
Where this goes next
So far the answer leans yes. On 6 of 7 report days the best foundation model beat the consensus, 6 models beat it over the season, and the median foundation model beat it on 4 of 7, all from public revenue history.
The next steps follow from that. The four remaining report days will add to the sample, and feeding the models some of the context analysts use, like guidance or related series, is the obvious way to go after misses like AMD.
Notes
- Series are from each company's SEC filings and quarterly reports, in USD millions. Fiscal quarters follow each company's calendar, so Apple's Q4 FY2026 and Nvidia's Q3 FY2027 line up with the calendar Q3 season.
- Wall Street consensus sources. Coinbase $1,100M, Zacks, October 26, 2026, for net revenue. Apple $57.18B, Zacks, Oct 31, 2026. LSEG had $56.54B, and against it 17 of 33 models beat Wall Street instead of 7. Palantir $2,170M, Zacks, Oct 31, 2026. AMD Data Center $8,270M, Zacks, Oct 29, 2026. McDonald's $7,280M total and $4,520M franchised, Zacks, Oct 30, 2026. Shopify GMV $120.03B, StreetAccount via CNBC, Nov 3, 2026.
- The season score is the geometric mean over the report days of |model miss| ÷ |seasonal-naive miss| on the same report day. Cross-validation scores are the geometric mean over all 11 series, including the 4 that haven't reported.
- Foundation models and seasonal naive were called through the FoundationForecast API. The other 8 models ran locally on a quarterly calendar (AutoARIMA, AutoETS and AutoTheta are also available in FoundationForecast but were run locally here) with the same 12 cross-validation quarters, each refit on the data before its cutoff, and were scored against the API's seasonal naive on every fold. AutoARIMA, AutoETS and AutoTheta used a season length of 4. N-BEATS used generic stacks with an input of 4 quarters. Prophet used yearly seasonality with 2 Fourier terms.
- GIFT-Eval and fev-bench numbers come from their public results, the same snapshot as the OpenRouter tokens study, aggregated the way each leaderboard does (MASE relative to seasonal naive, geometric mean). GIFT-Eval quarterly uses its M4 quarterly configuration. TimeH2O has no public entry on either. Correlations are Spearman, foundation models only.
- Nothing here is investment advice.
- The interactive companion is the TimeCopilot Analyst Terminal. Data and code are in github.com/TimeCopilot/experiments/tree/main/wallstreet.
References
- TimeCopilot. (2026). Can we predict token usage using transformer based models? timecopilot.github.io/experiments/openroutertokens/
- U.S. Securities and Exchange Commission. EDGAR full text search and company filings. sec.gov/edgar/search/
- Hyndman, R. J. (2026, August 25). Evaluating time series foundation model claims. Hyndsight. robjhyndman.com/hyndsight/foundation_models.html
- Bergmeir, C. (2024). LLMs and foundational models: Not (yet) as good as hoped. Foresight: The International Journal of Applied Forecasting, 73, 33-38. cbergmeir.com/papers/Bergmeir2024LLMs.pdf
- Meyer, M., Kaltenpoth, S., Zalipski, K., & Müller, O. (2025). Rethinking evaluation in the era of time series foundation models: (Un)known information leakage challenges. arXiv:2510.13654. arxiv.org/abs/2510.13654
- Assimakopoulos, V., & Nikolopoulos, K. (2000). The theta model: A decomposition approach to forecasting. International Journal of Forecasting, 16(4), 521-530. doi.org/10.1016/S0169-2070(00)00066-2
- Hyndman, R. J., & Khandakar, Y. (2008). Automatic time series forecasting: The forecast package for R. Journal of Statistical Software, 27(3), 1-22. doi.org/10.18637/jss.v027.i03
- NeuGroup. (2024, October 9). Bloomberg Terminals: How much more you'll pay next year. connect.neugroup.com/public/blogs/bloomberg-terminals-how-much-more-youll-pay-next-year
- Bloomberg News. (2017, August 15). UBS is said to charge about $40,000 for basic MiFID research. bloomberg.com/news/articles/2017-08-15/ubs-is-said-to-charge-about-40-000-for-basic-mifid-research
- Bloomberg News. (2019, April 23). From $1,600 to $1 million: What research costs under MiFID II. bloomberg.com/news/articles/2019-04-23/from-1-600-to-1-million-what-research-costs-under-mifid-ii
- Pluang. (2026, October 2). A quarter of companies have no analyst coverage (summarizing Seeking Alpha). pluang.com/en/news-feed/seperempat-perusahaan-tanpa-analisis-penutup
- Derrien, F., & Kecskés, A. (2013). The real effects of financial shocks: Evidence from exogenous changes in analyst coverage. The Journal of Finance, 68(4), 1407-1440. doi.org/10.1111/jofi.12042
- Garza, A., Rosillo, R., Mendoza-Smith, R., Salinas, D., Williams, A. R., Ashok, A., Goswami, M., & Juárez, J. M. (2026). Impermanent: A live benchmark for temporal generalization in time series forecasting. arXiv:2603.08707. arxiv.org/abs/2603.08707 Live leaderboard at impermanent.timecopilot.dev
- Hyndman, R. J., & Koehler, A. B. (2006). Another look at measures of forecast accuracy. International Journal of Forecasting, 22(4), 679-688. robjhyndman.com/papers/mase.pdf
- Aksu, T., Woo, G., Liu, J., Liu, X., Liu, C., Savarese, S., Xiong, C., & Sahoo, D. (2024). GIFT-Eval: A benchmark for general time series forecasting model evaluation. arXiv:2410.10393. arxiv.org/abs/2410.10393 Leaderboard and results at huggingface.co/spaces/Salesforce/GIFT-Eval
- Shchur, O., Ansari, A. F., Turkmen, C., Stella, L., Erickson, N., Guerron, P., Bohlke-Schneider, M., & Wang, Y. (2025). fev-bench: A realistic benchmark for time series forecasting. arXiv:2509.26468. arxiv.org/abs/2509.26468 Results at github.com/autogluon/fev
- Williams, A. R., Ashok, A., Marcotte, É., Zantedeschi, V., Subramanian, J., Riachi, R., Requeima, J., Lacoste, A., Rish, I., Chapados, N., & Drouin, A. (2024). Context is Key: A benchmark for forecasting with essential textual information. arXiv:2410.18959. arxiv.org/abs/2410.18959